
Performance Monitoring techniques in Java
Using Jconsole
The JConsole graphical user interface is a monitoring tool that complies to the Java Management Extensions (JMX) specification.
JConsole uses the extensive instrumentation of the Java Virtual Machine (JavaVM) to provide information about the performance and resource consumption of applications running on the Java platform.
In the Java Platform, Standard Edition (Java SE platform) 6, JConsole has been updated to present the look and feel of the Windows &(other platforms will present the standard Java graphical look and feel). The screen captures presented in this document were taken from an instance of the interface running on Windows XP.
% jconsole :
If you want to monitor a specific application, and you know that application's process ID, then you can also start JConsole so that it connects to that application. This application must be running with the same user ID as JConsole. The command syntax to start JConsole for local monitoring of a specific application is the following.
% jconsole processid :
For example: if you determined that the process ID of the Notepad application is 2956, then you would start JConsole with the following command.
% jconsole 2956 :
jstat:- the Java virtual machine Statistics Monitoring Tool.
jstatd:- the jstat daemon.
rmiregistry:-the Java Remote Object Registry.
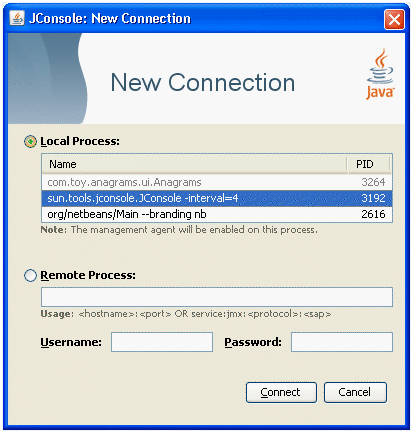
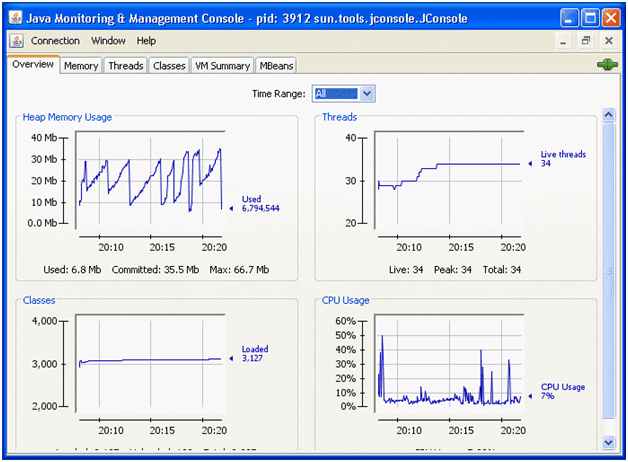
Figure : Overview Tab
JConsole uses the extensive instrumentation of the Java Virtual Machine (JavaVM) to provide information about the performance and resource consumption of applications running on the Java platform.
In the Java Platform, Standard Edition (Java SE platform) 6, JConsole has been updated to present the look and feel of the Windows &(other platforms will present the standard Java graphical look and feel). The screen captures presented in this document were taken from an instance of the interface running on Windows XP.
Setting up Local Monitoring :
You start JConsole by typing the following command at the command line.% jconsole :
If you want to monitor a specific application, and you know that application's process ID, then you can also start JConsole so that it connects to that application. This application must be running with the same user ID as JConsole. The command syntax to start JConsole for local monitoring of a specific application is the following.
% jconsole processid :
For example: if you determined that the process ID of the Notepad application is 2956, then you would start JConsole with the following command.
% jconsole 2956 :
jstat:- the Java virtual machine Statistics Monitoring Tool.
jstatd:- the jstat daemon.
rmiregistry:-the Java Remote Object Registry.
Screen Shot of Jconsole
If you start JConsole without providing a specific JMX agent to connect to, you will see the following dialog window.Presenting the JConsole Tabs:-
Once you have connected JConsole to an application. JConsole is composed of six tabs.Overview
|
Displays overview information about the Java VM and monitored values. |
Memory
|
Displays information about memory use. |
Threads
|
Displays information about thread use. |
Classes |
Displays information about class loading. |
VM |
Displays information about the Java VM. |
Mbeans
|
Displays information about MBeans. |
Viewing Overview Information:-
The Overview tab displays graphical monitoring information about CPU usage, memory usage, thread counts, and the classes loaded in the Java VM, all in a single screen.Figure : Overview Tab